Streaming to Power BI
Power BI can be used in conjunction with streaming data. One of the easiest ways to do so is with the Power BI sink (output) in Stream Analytics. There are other methods such as the REST API and PubNub:
- REST API: custom applications can use the Power BI REST API to stream data to Power BI
- PubNub: connect real-time data from PubNub channels to Power BI
If you followed along in the previous section, you already have a Stream Analytics job with an IoT Hub input and a Blob storage sink. The two are connected with the following query:
SELECT
    temperature, humidity, co2, tvoc,
    System.TimeStamp AS time, gebaAirQ.IoTHub.ConnectionDeviceID AS device
INTO
    "gebaAirQ-blob"
FROM
    gebaAirQ TIMESTAMP BY EventEnqueuedUtcTime
To bring real-time data to Power BI, we first have to add a Power BI sink. Stop the job and add the sink. You will need a Power BI account to do so and you will need to authorize with Power BI:
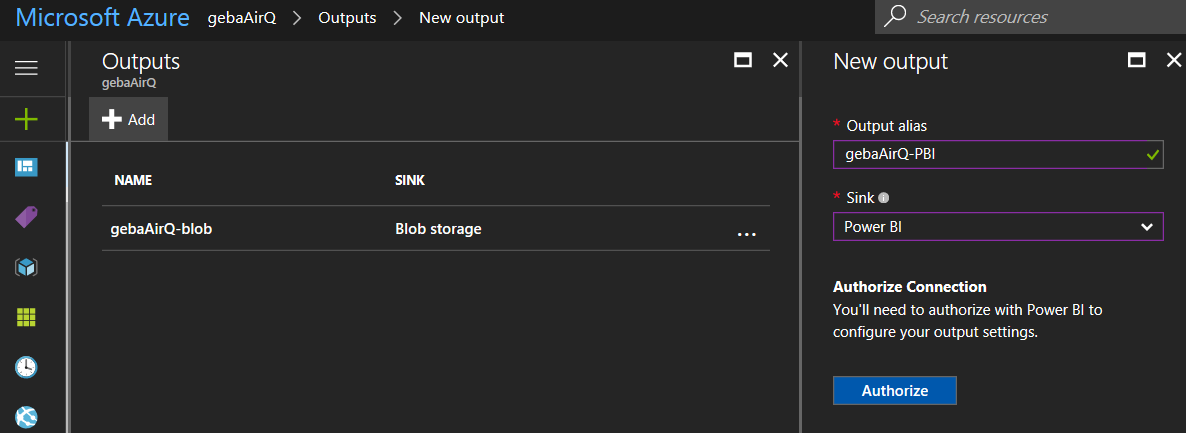
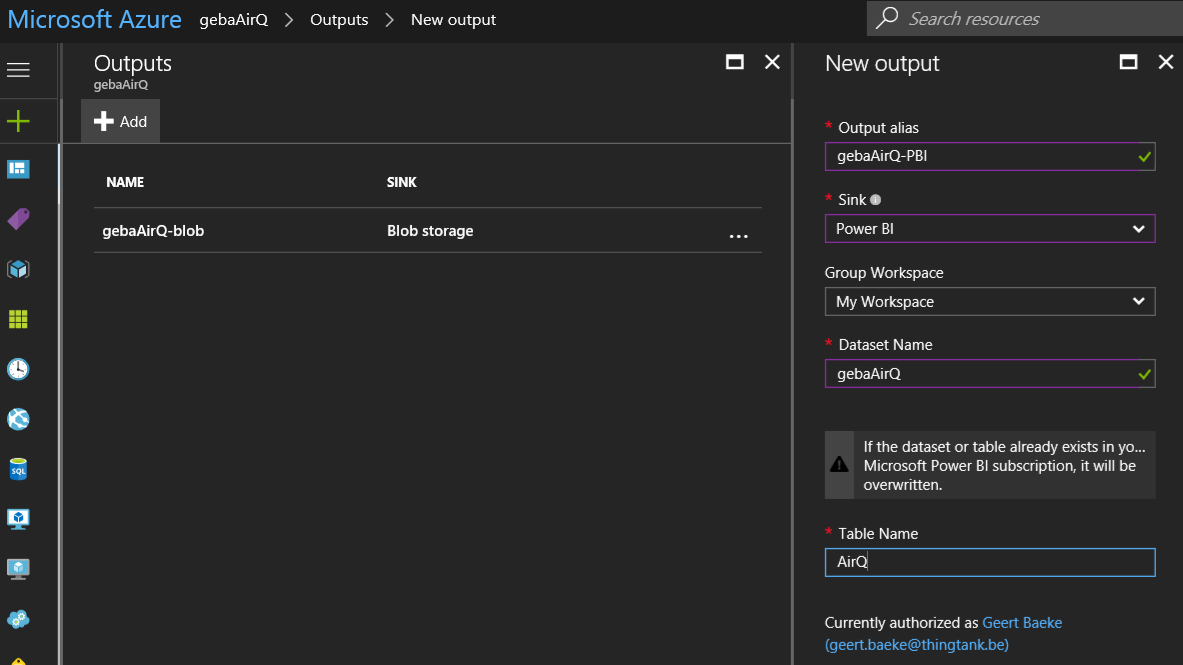
Click the Authorize button and provide your credentials to Power BI. Then provide the Group Workspace (use My Workspace) and provide a name for the dataset:
With the sink in place, we need to modify our query to bring data from our IoT Hub to Power BI by simply adding another SELECT statement to the existing query. The full query then becomes:
SELECT
    temperature, humidity, co2, tvoc,
    System.TimeStamp AS time, gebaAirQ.IoTHub.ConnectionDeviceID AS device
INTO
    "gebaAirQ-blob"
FROM
    gebaAirQ TIMESTAMP BY EventEnqueuedUtcTime

SELECT
    AVG(temperature) AS avgTemp, AVG(humidity) AS avgHum, AVG(co2) AS avgCo2, AVG(tvoc) AS avgTvoc,
    System.TimeStamp AS time, gebaAirQ.IoTHub.ConnectionDeviceID AS device
INTO
    "gebaAirQ-PBI"
FROM
    gebaAirQ TIMESTAMP BY EventEnqueuedUtcTime
GROUP BY
    gebaAirQ.IoTHub.ConnectionDeviceID, TumblingWindow(second, 30)
The first SELECT statement was created in the previous section. The second SELECT statement brings the data from IoT Hub to Power BI with an added twist. The GROUP BY clause causes the data to be grouped by device ID (you cannot use the short name device there) and a time window. Stream Analytics has three types of time windows and the tumbling window, a non-overlapping window, is the simplest and easiest to understand. In our case, for each consecutive 30 second window, the averages of our sensor values are sent to Power BI.
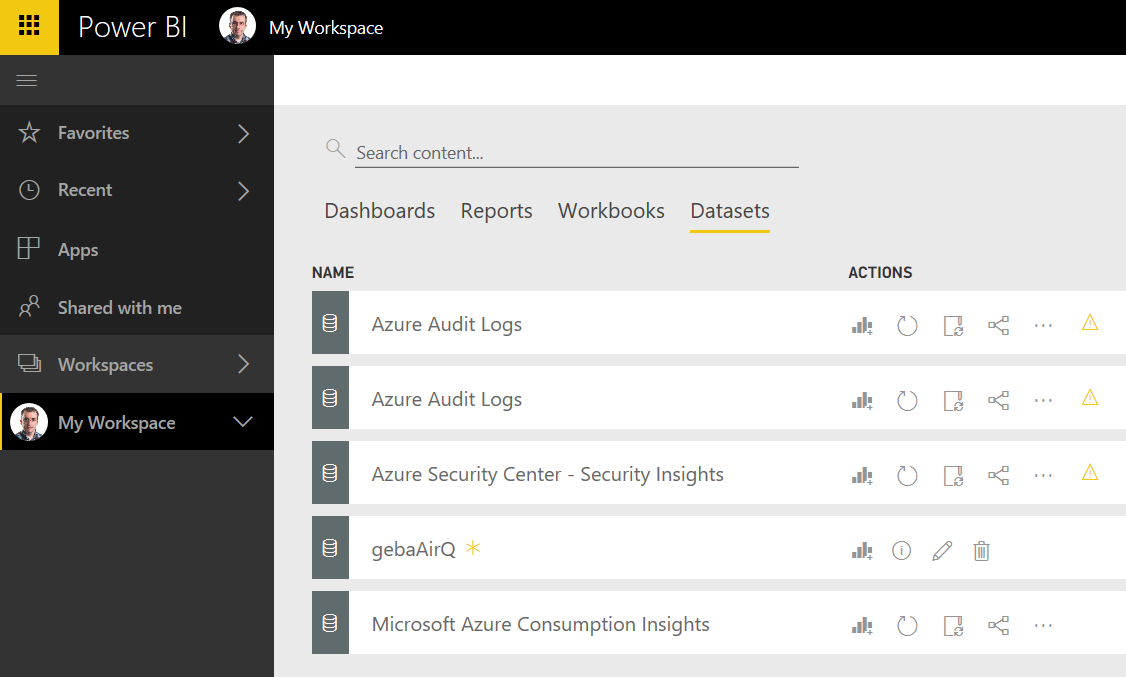
When you start the job, Stream Analytics will automatically connect to Power BI and create a streaming dataset (gebaAirQ):
 If you click the pencil icon, you will see that the values from the stream are defined and that they correspond with the fields from our SELECT statement. The only thing you need to do now is to create a dashboard and add a tile. In the screenshot below, I added a real-time data tile of type line chart with time on the axis, device as the legend and humidity as the value:
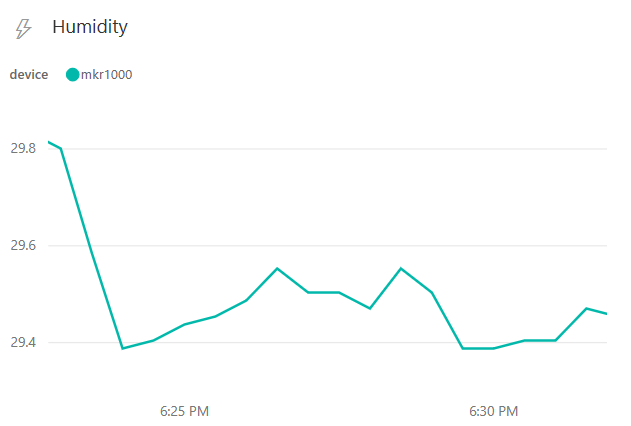
The lightning icon indicates that the chart is a real-time chart. The time window for the chart is set to 10 minutes in order to get twenty data points on the chart. Remember that we configured a tumbling window in the Stream Analytics query that results in values being sent every 30 seconds.
Note that by default, the historical data is also saved in Power BI (it is a setting of the dataset) allowing you to create historical multi-page reports and not just real-time tiles.
Now we will add yet another sink to Stream Analytics because we still want our real-time service from Chapter 1 to stay operational. Instead of connecting the Azure Function to IoT Hub directly, we will forward our data to another Event Hub and connect the Azure Function to it.