Stream Analytics
Stream Analytics is an easy to use Azure service that can be connected to an Event Hub or the Event Hub-compatible endpoint of IoT Hub to interact with streaming data as it comes in.
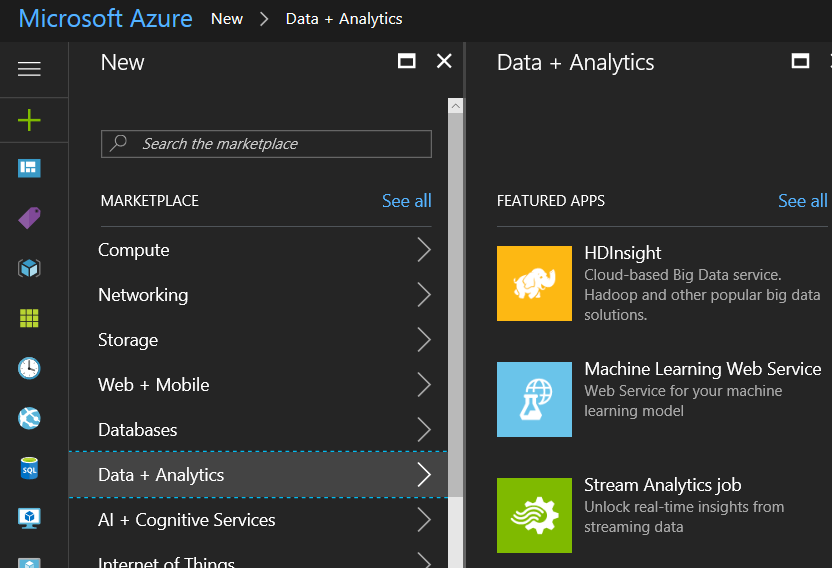
Let's dive right in and create a Stream Analytics job from the portal. You will find Stream Analytics job in the Data + Analytics section when creating a new resource:
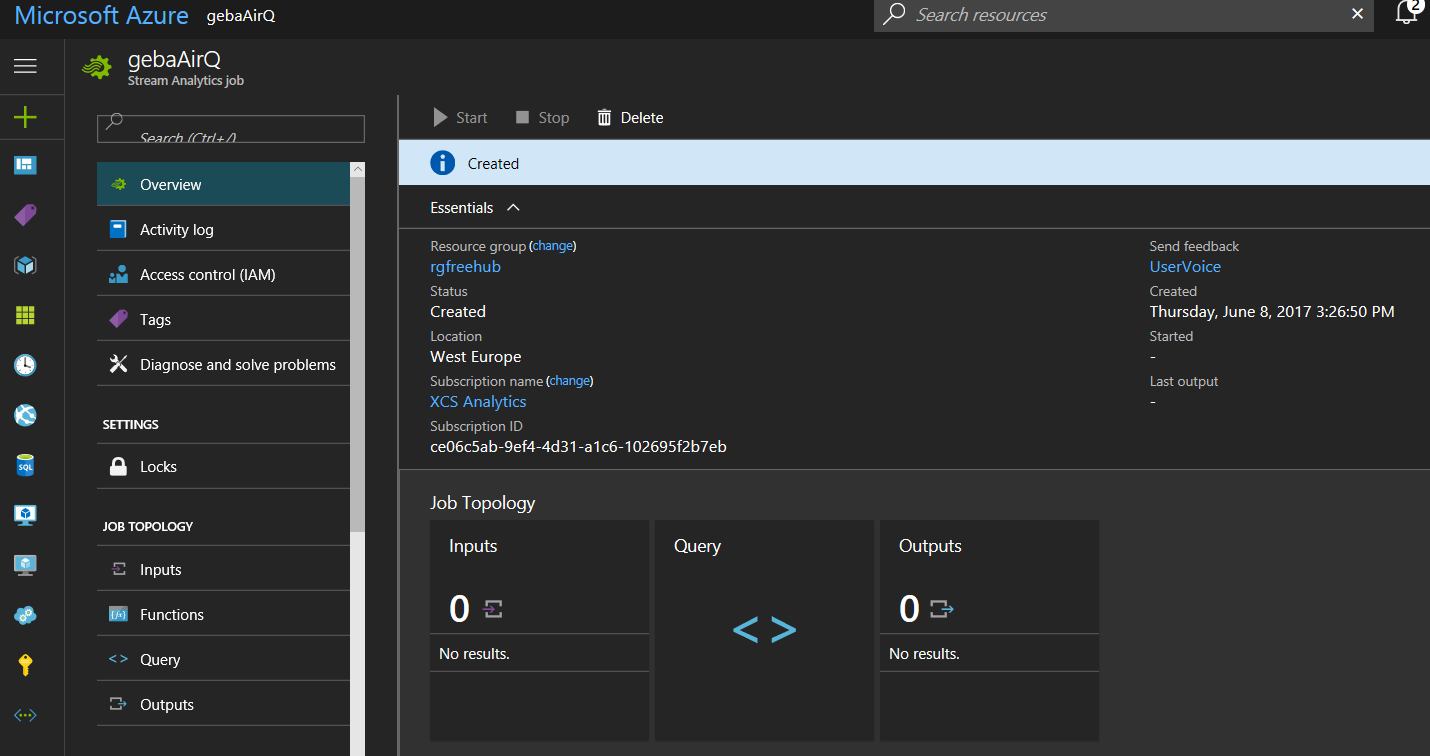
Give the job a name, select the subscription and set the resource group and location. A freshly created Stream Analytics job is show in the portal like below:
Inputs
To create the job, you first define inputs.There are two types of inputs:
- Data stream: data coming from an Event Hub or an IoT Hub
- Reference data: data in blob storage that you want to use with your streaming data; we will show a use case later on
When you use an Event Hub or IoT Hub as input, it is recommended to create a new consumer group that will be used by Stream Analytics. In your IoT Hub, in the Endpoints section, click Events. You can then add a new consumer group. I created a consumer group called sa.
In the Stream Analytics job, click Inputs and then click the Add link to add an input of type Data Stream. Be sure to use the consumer group you just added: The configuration is pretty straightforward. You will notice that you can select the event serialization format which can be Avro, CSV or JSON. JSON is the default and that is what we need here because our device sends JSON..
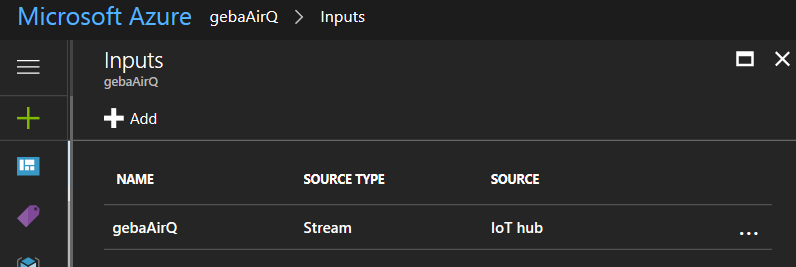
When you click create, the input is tested. You should receive a message that the connection was successfully tested. The input is now listed in the portal:
Outputs
Stream Analytics will read your input data from IoT Hub as a stream, process it, and send it to an output. We will get to the processing in a minute and first take a look at the different output types. Stream Analytics calls them sinks and there are many types:
- SQL database
- Blob storage
- Event hub
- Table storage
- Service bus Queue
- Service bus Topic
- DocumentDB
- Power BI
- Data lake Store
Configuring the sink is a simple matter of selecting the sink type and then specifying the required options. Let's create a simple sink of type Blob storage. Blob storage needs the following settings:
- Storage account: name of the storage account (select from list)
- Storage account key: automatically set
- Container: you can create a new container or select an existing container; a container in a storage account is similar to a folder
- Path pattern: specify a path and use {date} and {time} variables in the path; I used aqdata/{date} to group sensor readings per day in the specified container
- Date format: choose from several formats; I chose YYYY/MM/DD
- Event serialization format: Avro, JSON or CSV; I chose CSV to illustrate that Stream Analytics can translate JSON input to CSV output; when you select CSV you can set the delimiter which by default is a comma
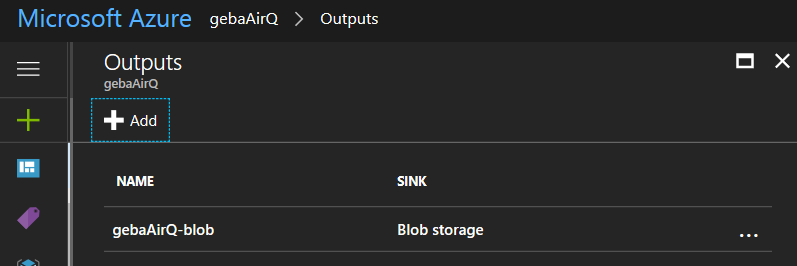
When you create the output, it is automatically tested. You now have defined a blob storage output:
Your streaming job now has an input and an output but nothing that connects the two. That is where queries come in and they are discussed next.
Query
When you hear the word query, are you also thinking about SQL? Well if you are, you are not mistaken here since Stream Analytics queries are written in a SQL-like query language. The query language is a subset of standard T-SQL syntax.
Let's start with the simplest query you can write. Click Query in the Overview section of Stream Analytics and then type the query as shown below:
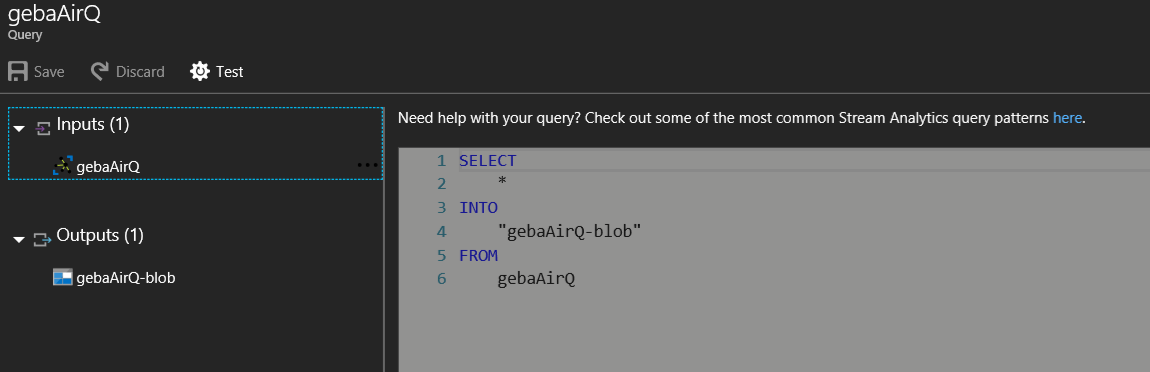
It is pretty clear what the above query does. Note that double quotes are required when you use characters that the query language does not like. When your query is ready and you see so no red lines indicating an error, you can start the job from the Overview section of Stream Analytics.
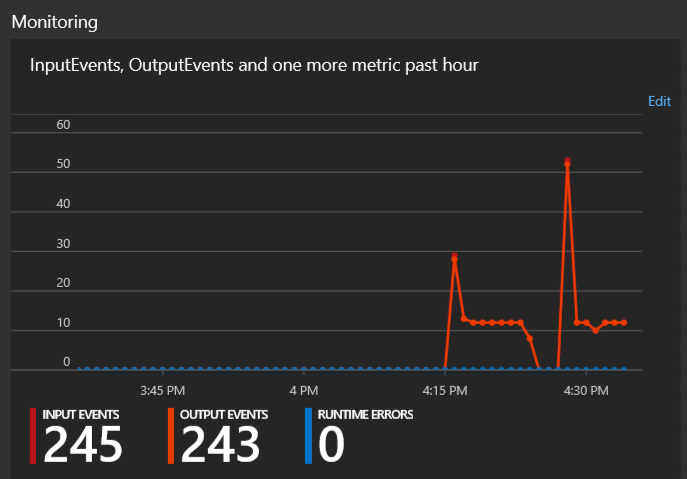
When the job is started and events are processed, you will get some nice metrics on the Overview screen:
The sensor data will now be saved to your configured storage account. Use Storage Explorer to easily view and download the data:
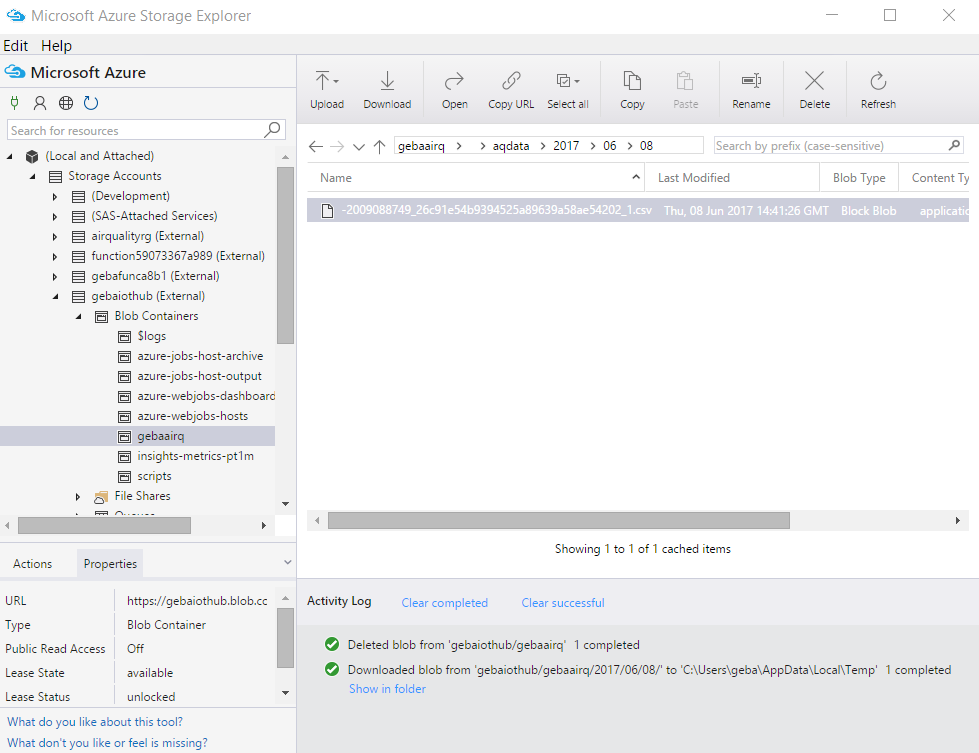 When you use {date} in the configuration of the storage blob sink, the data is organised into year, month and day folders. In the day folders, there will be one or more files in the .csv format. By simply double clicking such a .csv file, you can download and open it, for instance with Excel:
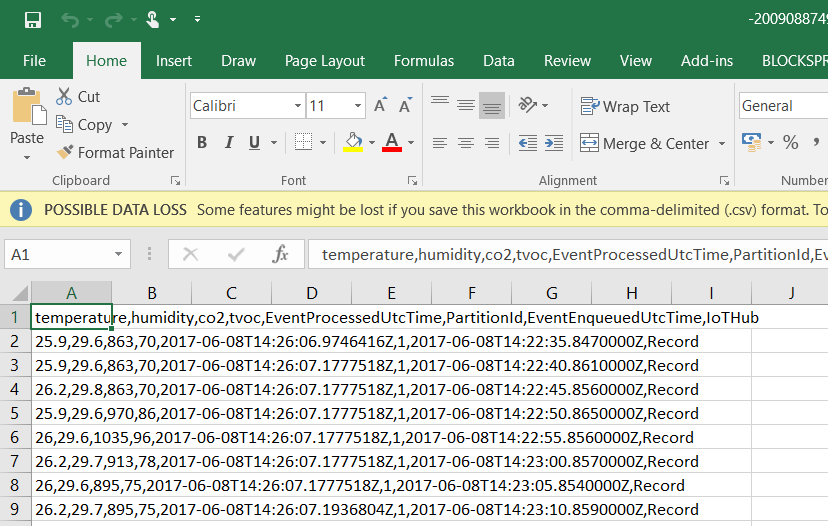
The measurements from our device are nicely listed, in addition to some other fields added by the system:
- EventProcessedUtcTime: the time when the event was processed
- EventEnqueuedUtcTime: the time when the event entered the queue
- PartitionId: the id of the Event Hub partition; the Events endpoint of my IoT Hub has two partitions but messages from one device will always be sent to the same partition (using a hashing function); this is why you always see partition id 1 in the list
You will probably notice that something is off with the timings in the above list. The EventEnqueuedUtcTime roughly corresponds with the 5 second report interval of the device but the above events are all processed at the same time. This is because I stopped the job while data was still coming into IoT Hub. When the job was restarted, Stream Analytics asked from where processing should start:
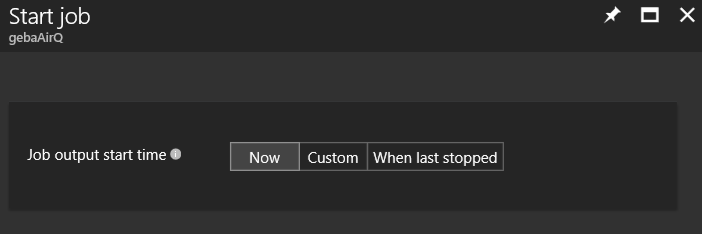
When you select When last stopped or set a Custom time, older messages in the Event Hub are picked up and processed in batches. This is actually a good thing because there might be times when you want to process all your data again, for instance when there is an error in your query.
There are several things I would like to change in the output:
- I do not want to log the EventProcessedUtcTime and partition Id
- I want to rename EventEnqueuedUtcTime to time
- I want to log the name of the device
- I want to make sure that Stream Analytics uses EventEnqueuedUtcTime as the system timestamp
That is quite easy to do with the following query:
SELECT
    temperature, humidity, co2, tvoc,
    System.TimeStamp AS time, gebaAirQ.IoTHub.ConnectionDeviceID AS device
INTO
    "gebaAirQ-blob"
FROM
    gebaAirQ TIMESTAMP BY EventEnqueuedUtcTime
By using TIMESTAMP BY on the input, we can explicitly set the system timestamp to one of the fields in the payload. In many cases, this will be a value you send from the device but in this case, we simply use the time when the event was enqueued. The field you set with TIMESTAMP BY can be used in your query as System.TimeStamp. We do that in the SELECT clause where we rename the field to time.
Getting the device id is not so obvious. Luckily, IoT Hub adds IoT Hub data to the Event Hub message as a JSON record called IoTHub. In the CSV output, the contents of the record is not shown and you just get the value called record. You can get values out of the record as demonstrated in our query. The device Id as specified in the IoT Hub device registry is ConnectionDeviceID.
The result of the above query is as follows:
temperature,humidity,co2,tvoc,time,device
25.2,32.4,400,0,2017-06-08T12:31:53.4400000Z,mkr1000
24.8,32.2,400,0,2017-06-08T12:31:58.3610000Z,mkr1000
24.8,32.2,400,0,2017-06-08T12:32:03.3540000Z,mkr1000
24.9,32.2,400,0,2017-06-08T12:32:08.3590000Z,mkr1000
24.9,32.2,400,0,2017-06-08T12:32:13.3660000Z,mkr1000
24.9,32.3,400,0,2017-06-08T12:32:18.3630000Z,mkr1000
Great, we now have configured Stream Analytics to log sensor data to a storage account. Let's continue with showing real-time data in a Power BI dashboard.