Application Monitoring
In this chapter, we will add monitoring functionality to the application. To monitor Kubernetes and the IoT app, Prometheus will be used. To easily visualize the metrics collected by Prometheus, we will use Grafana. Grafana comes with a built-in data source for Prometheus.
A lot can be said about Prometheus and Grafana but we will focus on the following basics:
- Installation of Prometheus with Helm
- Installation of Grafana with Helm
- Connecting Grafana to Prometheus
- Adding a predefined dashboard for Kubernetes
After we have the basics covered, we will add a metrics endpoint to the MQTT-to-Influx bridge we created in From MQTT to InfluxDB. We will also add a custom metric to our application to report on the amount of data points written to InfluxDB per second.
Installing Prometheus
There are several ways to install Prometheus. One way is to use the stable/prometheus Helm chart. Although the chart comes with many configuration options, we will use a default deployment. First, create a new namespace in Kubernetes:
kubectl create namespace monitoring
Next, install Prometheus in that namespace:
helm install --namespace monitoring stable/prometheus
As before, you can give your release a name with the --name parameter. If you don't, you will get a random name. To list the pods in the namespace use kubectl get pods -n monitoring:
NAME                                                          READY     STATUS    RESTARTS   AGE
broken-snake-prometheus-alertmanager-77bccb4c4-kwvkh          2/2       Running   0          22h
broken-snake-prometheus-kube-state-metrics-7c49b98c76-pzbdc   1/1       Running   0          22h
broken-snake-prometheus-node-exporter-flx87                   1/1       Running   0          23h
broken-snake-prometheus-node-exporter-rzk5c                   1/1       Running   0          23h
broken-snake-prometheus-node-exporter-v8p5p                   1/1       Running   0          23h
broken-snake-prometheus-pushgateway-7f9dbcf9b6-8qths          1/1       Running   0          22h
broken-snake-prometheus-server-59657bccfc-85cqt               2/2       Running   0          23h
Yep, the random name I got was broken snake. To connect to the Prometheus server, I used the following command:
kubectl port-forward broken-snake-prometheus-server-59657bccfc-85cqt 9090
Next, connect to http://localhost:9090 to see the Prometheus web UI. Then select Status / Targets from the menu:
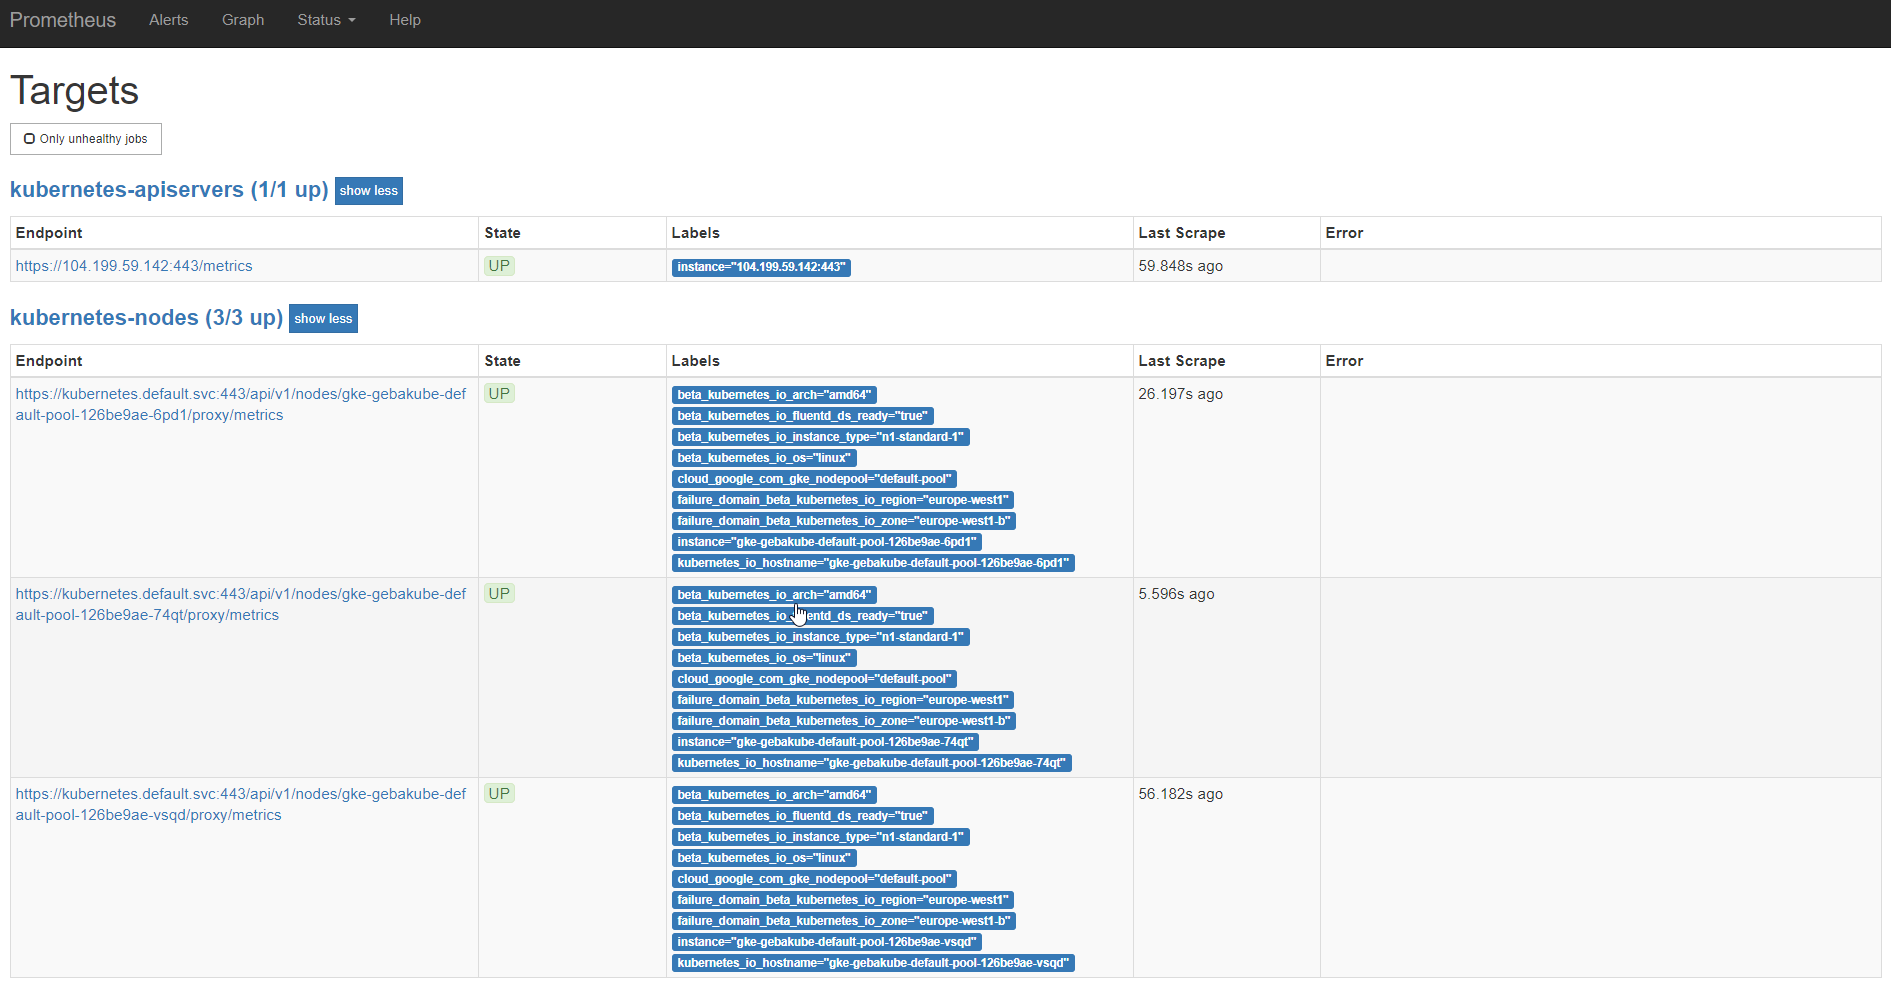 Prometheus connects to these targets at regular intervals to pull metrics from an endpoint (called scraping). For custom endpoints, /metrics on port 9100 is used regularly but as the above screenshot shows, that is not a requirement. Note that the above targets were added during deployment of the Helm chart and provide a lot of metrics about your Kubernetes deployment out of the box.
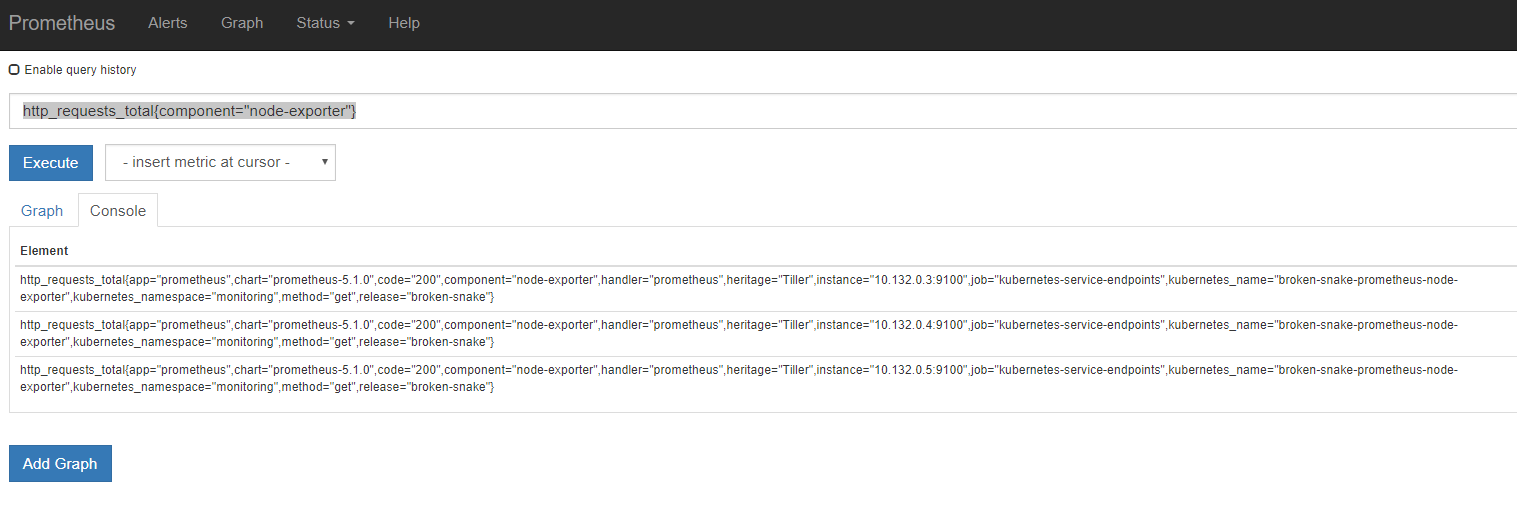
Prometheus allows you to query the gathered metrics with expressions written in PromQL. You can find several examples at https://prometheus.io/docs/prometheus/latest/querying/examples. You can query data in the Prometheus UI via the Graph link. Click Graph and then type http_requests_total in the text box. Next, click Execute. The result will be a list of time series, one per resource. Resources have labels that can be used to filter the time series you want returned. If you only want to see the time series for the node exporters, use http_requests_total{component="node-exporter"}:
 If you click the Graph tab, you can visualize these time series:
 The data in this time series is a counter for the total amount of http requests that resulted in a 200 response. Later you will see how to create these counters yourself and how you can visualize them in other ways.
Installing Grafana
Grafana will be used to create dashboards. Install it with Helm:
helm install --name dashboard stable/grafana
Grafana will be installed in the default namespace. A user called admin will be created with a randomly generated password. Grab the password from the Helm output or from the dashboard-grafana opaque secret if you used the Helm release name dashboard. Don't forget to use base64 --decode to decode the grafana-admin-password.
Grafana listens on port 3000 so port forward that port to your local machine and browse to http://localhost:3000. Login using admin and the random password. Next, add a data source of type Prometheus. The URL to access Prometheus is derived from the Kubernetes service name and its namespace. In my case, the URL was:
http://broken-snake-prometheus-server.monitoring
The URL basically makes use of Kubernetes DNS to allow Grafana to connect to our Prometheus instance. We can now add a dashboard. Click the Grafana icon (top/left) and click Dashboards. From Dashboards, click Import. In Grafana.com Dashboard, type 1621 and click Load. You will get the following dashboard:
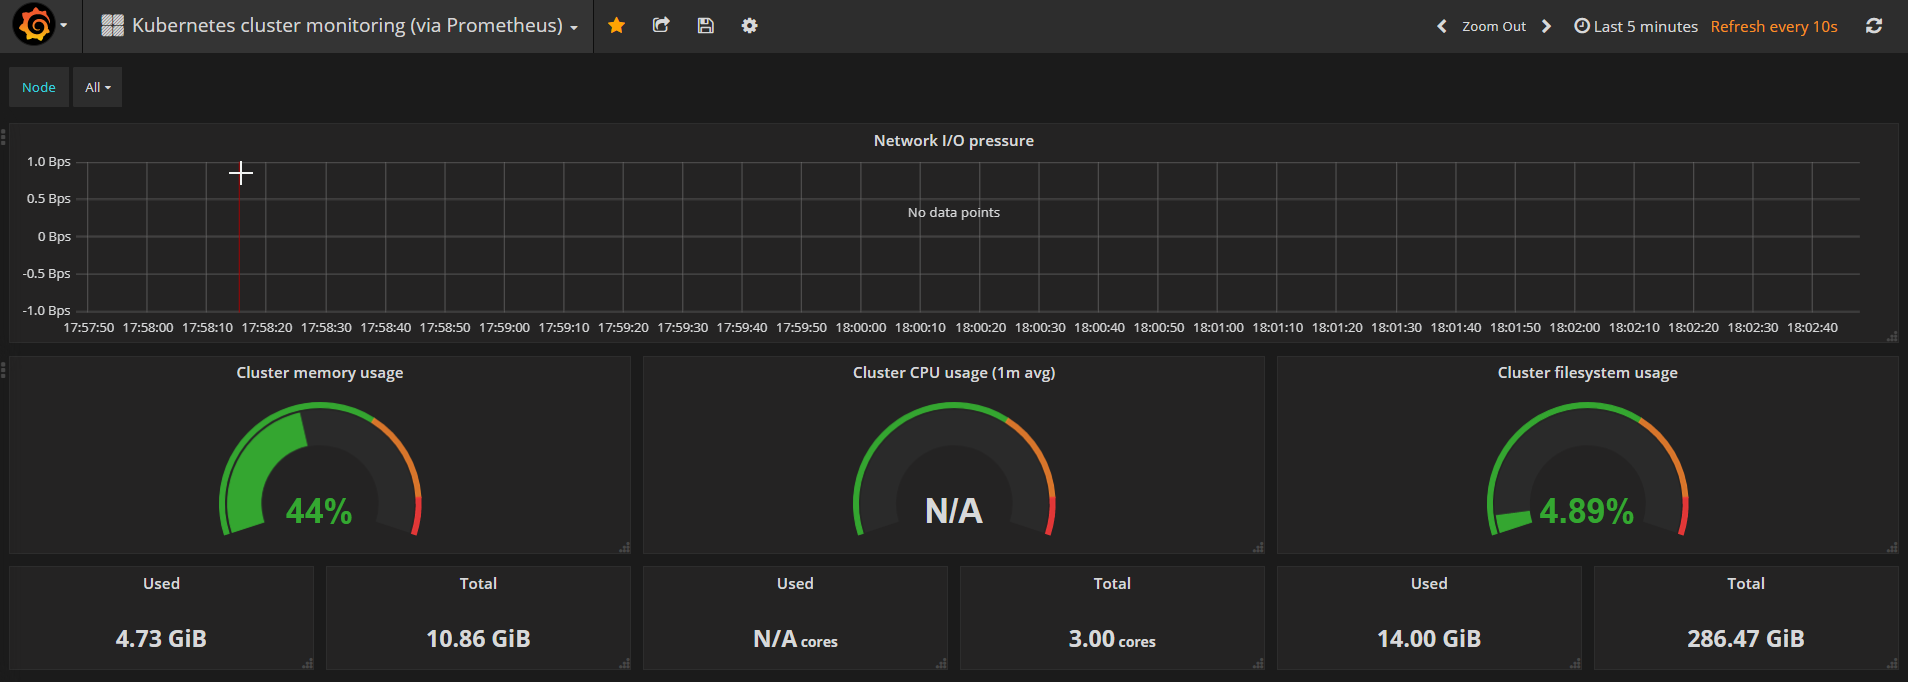 Note that some metrics are not shown. In many cases, this is due to authorization issues. Solving these is beyond the scope of this book.
With Grafana installed, we can focus on exposing metrics for our own applications and visualize them in a dashboard.
Application Metrics
Prometheus has many client libraries you can incorporate in your own code to generate metrics. See https://prometheus.io/docs/instrumenting/clientlibs for a list of these libraries. We will do two things:
- expose Go metrics by incorporating the Go client library in our code
- expose a custom metric
Before diving into the code, let's take a look at the types of metrics in Prometheus. The libraries offer four types of metrics although the Prometheus server, at the time of this writing (version 2.x), does not make use of these types and flattens the data into an untyped time series. This is clearly explained in https://prometheus.io/docs/concepts/metric_types/.
We will use one of the four types, the counter. A counter is a cumulative metric. As such, it only goes up. If you need to represent a value that can go up or down, you should use the gauge type. Suppose we want to record the number of writes to InfluxDB in our MQTT-to-InfluxDB bridge. Every time we have a successful write, we just increment the counter in our code. With PromQL expressions, we can derive per second metrics easily and visualize them in Grafana.
Two other types, histogram and summary, are designed to count observations in configurable buckets. We will not use those types in our code.
To provide Prometheus metrics for our MQTT-to-InfluxDB bridge, add the following file, metric.go:
package main

import (
    "log"
    "net/http"
    "github.com/prometheus/client_golang/prometheus/promhttp"
)

// metrics endpoint
func prometheusMetrics() {
    log.Println("Prometheus metrics")
    h := http.NewServeMux()
    h.Handle("/metrics", promhttp.Handler())
    http.ListenAndServe(":9100", h)
}
The function prometheusMetrics merely registers an http handler to respond to /metrics. The handler itself is defined in the Prometheus client library. After the handler is registered, we listen for incoming requests on port 9100 passing the ServeMux h. A ServeMux is a HTTP request router that matches incoming requests to defined paths in your code. The prometheusMetrics function is called from main() as a goroutine because it should run concurrently with our MQTT handler.
// start prometheus metrics in goroutine
go prometheusMetrics()
When you build and run the service locally, you can check the metrics with curl http://localhost:9100/metrics:
HELP go_gc_duration_seconds A summary of the GC invocation durations.
# TYPE go_gc_duration_seconds summary
go_gc_duration_seconds{quantile="0"} 7.232e-06
go_gc_duration_seconds{quantile="0.25"} 1.5248e-05
go_gc_duration_seconds{quantile="0.5"} 1.6352e-05
go_gc_duration_seconds{quantile="0.75"} 1.7521e-05
go_gc_duration_seconds{quantile="1"} 0.001963351
go_gc_duration_seconds_sum 0.018116083
To see the Go metrics in Grafana, add dashboard 3574 from grafana.com:

To add a custom metric, modify the code in metric.go as follows:
package main

import (
    "log"
    "net/http"

    "github.com/prometheus/client_golang/prometheus"
    "github.com/prometheus/client_golang/prometheus/promhttp"
)

var influxCount = prometheus.NewCounterVec(
    prometheus.CounterOpts{
        Name:      "influx_count",
        Namespace: "influx",
        Help:      "Influx writes",
    },
    []string{"device", "type"},
)

func init() {
    prometheus.MustRegister(influxCount)
}

// metrics endpoint
func prometheusMetrics() {
    log.Println("Prometheus metrics")
    h := http.NewServeMux()
    h.Handle("/metrics", promhttp.Handler())
    http.ListenAndServe(":9100", h)
}
influxCount is defined as a new Prometheus metric of type counter. Such a counter needs some options like the name, a namespace and help. The namespace is not related to Kubernetes namespaces but provides a way to group metrics. We will also add two tags, one for the device and one for the device type. This will allow us to filter the time series in reports.
Naturally, you will need to increase this counter each time a successful write happens. This happens in the writeToInfluxDB function in main.go. Before return nil at the end of that function, add the following line:
// data was written, update influxCount custom Prometheus metric
influxCount.WithLabelValues(m.Device, m.Type).Add(float64(1))
If you are only adding one to the counter, you can use the Inc() method instead. Prometheus values are of type float64.
Up until now, I have only checked the metrics by querying the /metrics endpoint directly. When you deploy the MQTT-to-InfluxDB bridge to Kubernetes, you need to tell Prometheus to start collecting the metrics from your pod. In this case, you can do this from the service definition. Remember that before, we did not have a service definition for the MQTT-to-InfluxDB bridge because we did not need to connect to it. Now, Prometheus needs to connect to our metrics endpoint which requires a service:
apiVersion: v1
kind: Service
metadata:
  annotations:
    prometheus.io/scrape: 'true'
  name: mqtt-client
  labels:
    app: mqtt-client
spec:
  type: ClusterIP
  ports:
  - port: 9100
    protocol: TCP
  selector:
    app: mqtt-client
Create the above YAML file and use kubectl apply -f your-filename to create the service.
Note the annotation prometheus.io/scrape which tells Prometheus to collect metrics from the Kubernetes service. Other annotations are:
- prometheus.io/scheme: set to https if the endpoint is secured
- prometheus.io/path: set it if you do not publish metrics on /metrics
- prometheus.io/port: set i if you do not use port 9100
After a while, there should be an additional target for this service:

In Grafana, we can create a new dashboard and add a Graph as follows:
 In the above graph, the following expression was used:
rate(influx_influx_count{type="airq"}[5m])
The rate function calculates the per-second rate of increase of the time series in the range vector. The range vector here is five minutes. You should only use rate with counters. It is best suited for alerting and graphing of slow-moving counters. Note that rate takes the first and last data points in the range to calculate the rate. If you want better resolution, use irate which stands for instant rate. It takes the last two data points in the range.
In this chapter, you saw how to monitor Kubernetes in addition to your own services. You should now be able to apply this knowledge to include useful counters and other metrics in your own code and create dashboards in Grafana to gain insights into your application. In the next section, we will briefly look at using Grafana to chart time series from InfluxDB directly.
Bonus: InfluxDB dashboard
In Realtime Browser Updates, we looked at using Freeboard to create a dashboard to show IoT data. The dashboard made use of our socket.io service and our REST API. Because our IoT data is saved to InfluxDB by our MQTT-to-InfluxDB bridge, we can also query InfluxDB directly from Grafana.
First, create a datasource for InfluxDB:
 Next, create a new dashboard and add a graph. Hover over Panel Title and click edit:
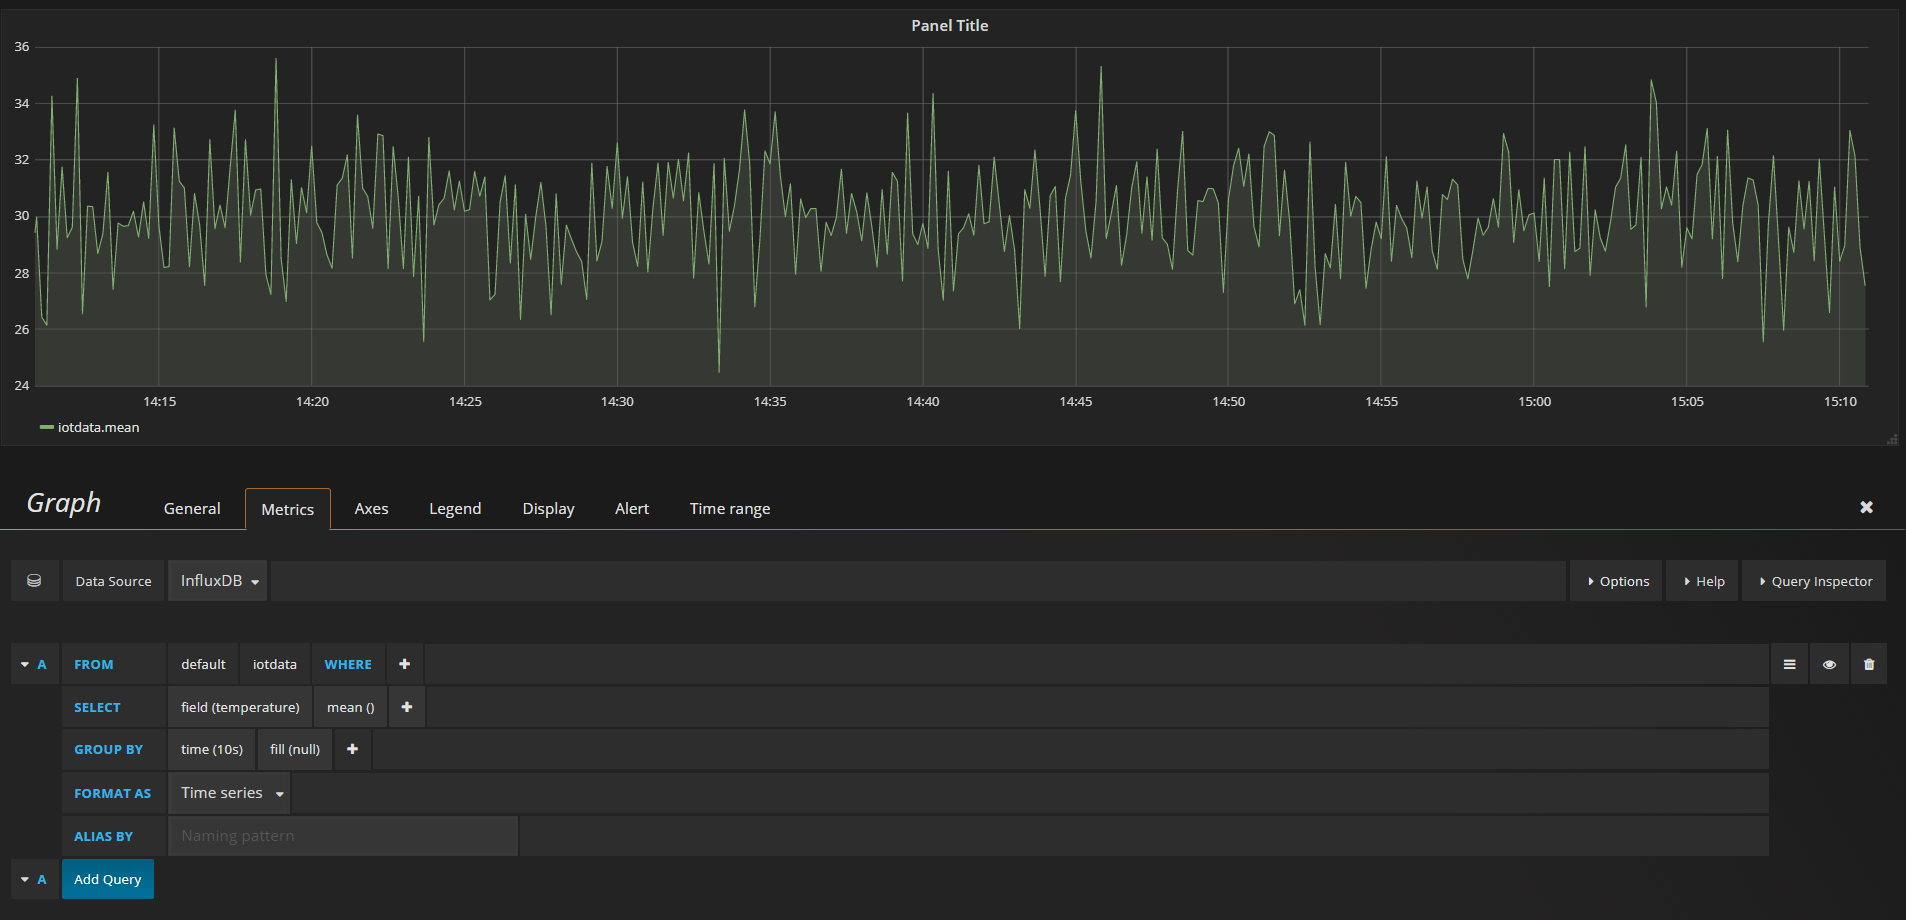 In the Metrics tab, simply select the datasource and build your InfluxDB query.
With a little bit of effort, you can easily create a dashboard like in screenshot below:
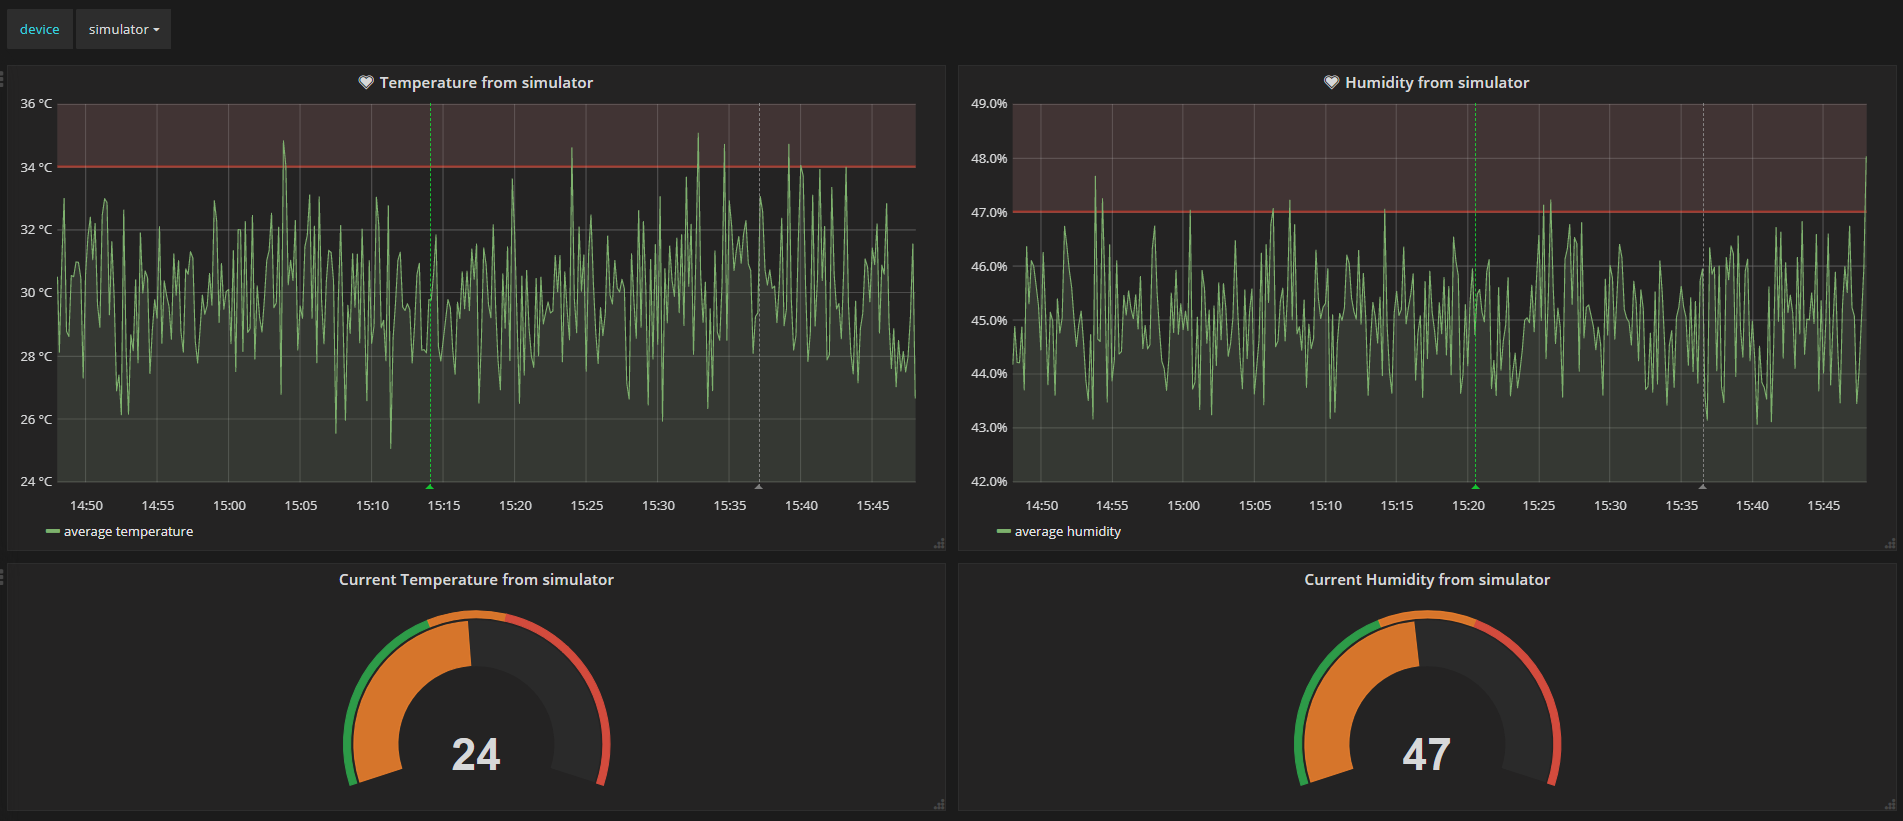
The dashboard above makes use of the templating feature to add a device variable. You can easily reference that value in text and queries. See http://docs.grafana.org/reference/templating for more information.